Profitability of Stocks in the Russell 2000 Index
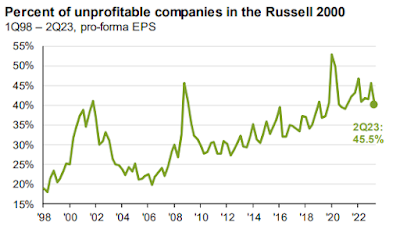
The below chart is a look at the percent of unprofitable companies in the Russell 2000, looking back from 1998 through the second quarter of 2023. This particular chart was in JPMorgan’s Guide to the Markets. On its own, it generates a number of questions. The primary question I asked myself is, Has the upward trend in unprofitable companies in the Russell 2000 impacted the return over the same time period?
When this was posted by JPMorgan and when I reviewed it, the markets had yet to pop from the positive news from Jerome Powell and the Fed of interest rates holding firm. Granted, the door is still open for more hikes, but the language and odd for now suggest a pause. Since that news, small cap stocks are up over 6%. But again, based on the timing of the post post Q3 and with how Q4 was starting, it seemed the implication of unprofitable companies was to suggest a possible reason for small cap underperformance in 2023. Perhaps the increase in unprofitable companies has led to an uptick in volatility and downside pressure during any time of uncertainty. That was my first thought, so perhaps I’m biased when thinking others made the same connection.
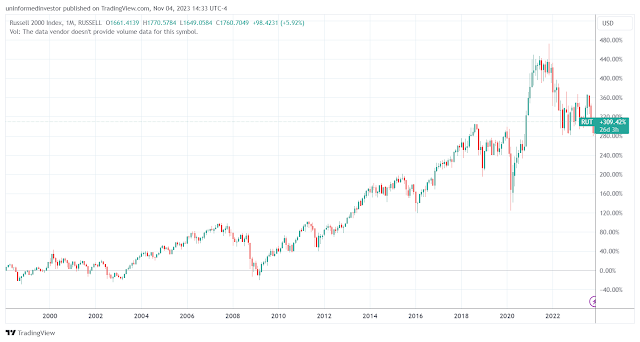
When looking at the historical returns of the Russell 2000 index (below), it seems far from the truth. In the same time period, (1998 to now) the Russell 2000 index has return a cumulative 309%. Annually, that math’s to roughly 12.25% each year. To be fair, that’s to be expected with the stock market - over time, stock prices appreciate and the riskier ones tend to appreciate a little more.
One thought to wrap this up - perhaps as the unprofitability trends up and the risk associate with small caps (one would assume) follows, the expected annual return may follow.


