Monday, June 24, 2024

Benchmarking - Are You Using the Right One?

Benchmarking

Benchmarking is defined as evaluating or checking something by comparison with a standard. When we think about investments, the benchmark is usually (right or wrong) the S&P 500 index. The trick to benchmarking is picking the right one. Investors with a lower risk tolerance with investments mostly in bonds and cash would likely be confused comparing the performance of their portfolios to the performance of the S&P 500. The same way an investor solely holding international stocks wouldn’t be wise to benchmark against the S&P 500. With the right comparison selected, we can better manage our expectations.  I was catching up with a friend recently and he brought this up with interest rates. The idea is that, since interest rates were at or near 0% since mid-2009, 0% is the benchmark many are using now. Thinking that rates will eventually be cut from the current 5.25% down to 0% again. Bringing with it the idea that mortgages could move back down to the 3%’s and car loans to the same territory. But 0% may be the wrong benchmark. The average Fed Funds rate since 1955 is 4.61%, while the Fed has stated their long-run projection is 2.80%. Perhaps expectations for mortgage rates and bond price growth need to be tempered when a more realistic benchmark is used.

Thursday, March 7, 2024

How To Start Investing With a Small Amount of Money


Investing can be a daunting subject – especially trying to figure out where, how, what, how much to start with. It seems like many guides and lists floating around start with the assumption that the investor has a few thousand dollars. It’s simply unrealistic. Fortunately, with the advancement of financial products (like low cost, index ETFs) and financial institutions’ ability to process trades, there are now feasible ways to get started for just a few bucks.

Saturday, November 4, 2023

Profitability of Stocks in the Russell 2000 Index

Profitability of Stocks in the Russell 2000 Index


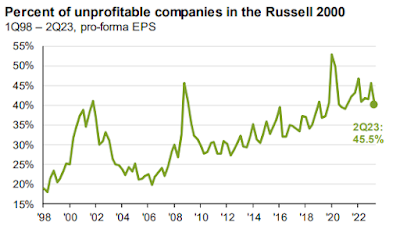
The below chart is a look at the percent of unprofitable companies in the Russell 2000, looking back from 1998 through the second quarter of 2023. This particular chart was in JPMorgan’s Guide to the Markets. On its own, it generates a number of questions. The primary question I asked myself is, Has the upward trend in unprofitable companies in the Russell 2000 impacted the return over the same time period?

When this was posted by JPMorgan and when I reviewed it, the markets had yet to pop from the positive news from Jerome Powell and the Fed of interest rates holding firm. Granted, the door is still open for more hikes, but the language and odd for now suggest a pause. Since that news, small cap stocks are up over 6%. But again, based on the timing of the post post Q3 and with how Q4 was starting, it seemed the implication of unprofitable companies was to suggest a possible reason for small cap underperformance in 2023. Perhaps the increase in unprofitable companies has led to an uptick in volatility and downside pressure during any time of uncertainty. That was my first thought, so perhaps I’m biased when thinking others made the same connection.

When looking at the historical returns of the Russell 2000 index (below), it seems far from the truth. In the same time period, (1998 to now) the Russell 2000 index has return a cumulative 309%. Annually, that math’s to roughly 12.25% each year. To be fair, that’s to be expected with the stock market - over time, stock prices appreciate and the riskier ones tend to appreciate a little more.


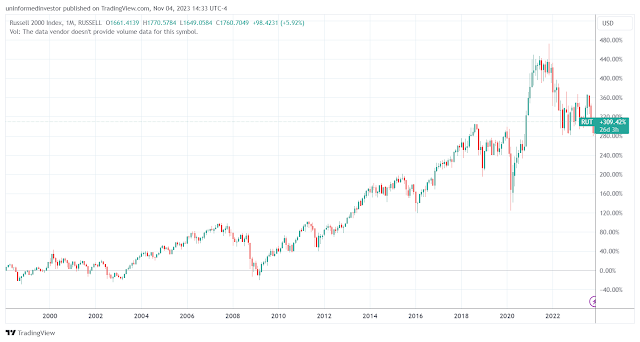
One thought to wrap this up - perhaps as the unprofitability trends up and the risk associate with small caps (one would assume) follows, the expected annual return may follow.

Monday, October 30, 2023

The Impact of Rates on Aggregate Bond

Interest rates and bond prices have an inverse relationship. When rates go up, bond prices go down, with the opposite being true as well. So as the Fed has hiked interest rates with breakneck speed to try and counter inflation, bond prices have fallen. 

The chart above is a look at the US Aggregate bond index as of September with forward charting estimates based on potential rate changes. Based on current duration and yield: 

  • If rates increase 1.0%, we can expect the yield to return 5.4% (current) while experiencing a negative price return of -6.2%. 
  • The middle hypothetical shows a 5.4% 1-year return, all earned from the yield. 
  • Should rates fall by 1.0%, investors would expect to earn the yield return of 5.4% along with the positive price return of 6.2% for a total 1-year return of 11.6%.

Saturday, May 22, 2021

Bitcoin: Blockchain, Mining, Energy


Bitcoin: Blockchain, Mining, Energy

It’s no secret that Bitcoin and cryptocurrencies, in general, have gained significant popularity and notoriety over the last 12 months. Most notably because the return has been an astronomical 430% over the time period, but also due to companies such as Tesla, MicroStrategy, and Square investing a collective $3.9 billion earlier this year. For anyone invested in Bitcoin or following the asset, this last year has not been without its ups and downs.

What is Bitcoin?

Bitcoin is a decentralized digital currency. All transactions made with bitcoin are noted on a public ledger and verified by a network of computers. Many people and companies are working to verify transactions instead of just one entity, making it decentralized. The public ledger of bitcoin transactions is stored in the blockchain.

Tuesday, March 30, 2021

Irrational Exuberance


Irrational Exuberance

There’s no question markets have been volatile this year. If we peel back the top layer, there are many different events we can blame it on: inflation, treasury yields, the Fed and interest rates, Covid vaccines, unemployment, even the colder than normal February. But, what if we didn’t peel back the top layer? Instead, we focus on a potential over-arching theme as a way to over-simplify what’s been happening in the stock market.

In a December 1996 nationally televised speech, then Chair of the Federal Reserve Board Alan Greenspan referred to the behavior of stock market investors as “irrational exuberance”. Since then, this term – irrational exuberance – has been used to in conjunction with speculative and instable markets.

In his bestselling book aptly titled Irrational Exuberance, author/economist/Nobel prize winner Robert Shiller defined it as,

“the psychological basis of a speculative bubble. I define a speculative bubble as a situation in which news of price increase spurs investor enthusiasm, which spreads by psychological contagion from person to person, and, in the process, amplifies stories that might justify the price increase and brings in a larger and larger class of investors, who, despite doubts about the real value of the investments, are drawn to it partly through envy of others’ successes and partly through a gambler’s excitement.”

One of the longer sentences you’ll see, but by breaking it down and providing some examples we can better understand what it means. And, how it might explain markets today.